
An analyst who accurately called Bitcoin’s correction in Q1 of 2024 believes BTC is close to printing a local bottom based on a technical momentum indicator.
Pseudonymous analyst Rekt Capital tells his 542,00 followers on the social media platform X that Bitcoin’s relative strength index (RSI) on the daily chart has plunged into oversold territory.
Traders keep a close eye on the RSI as it can often signal trend reversal points.
The crypto strategist says that since November of 2022, Bitcoin has mounted strong rallies each time the RSI dropped to oversold levels on the daily time frame.
“Bitcoin’s Daily RSI equaled 2022 Bear Market RSI levels (RSI=23.93) when the price crashed into the high $70,000s.
The only lower Daily RSI in this cycle was back in August 2023 (RSI=18.28).
Throughout this cycle, each visit into sub-25 RSI resulted in a trend reversal to the upside over time.”
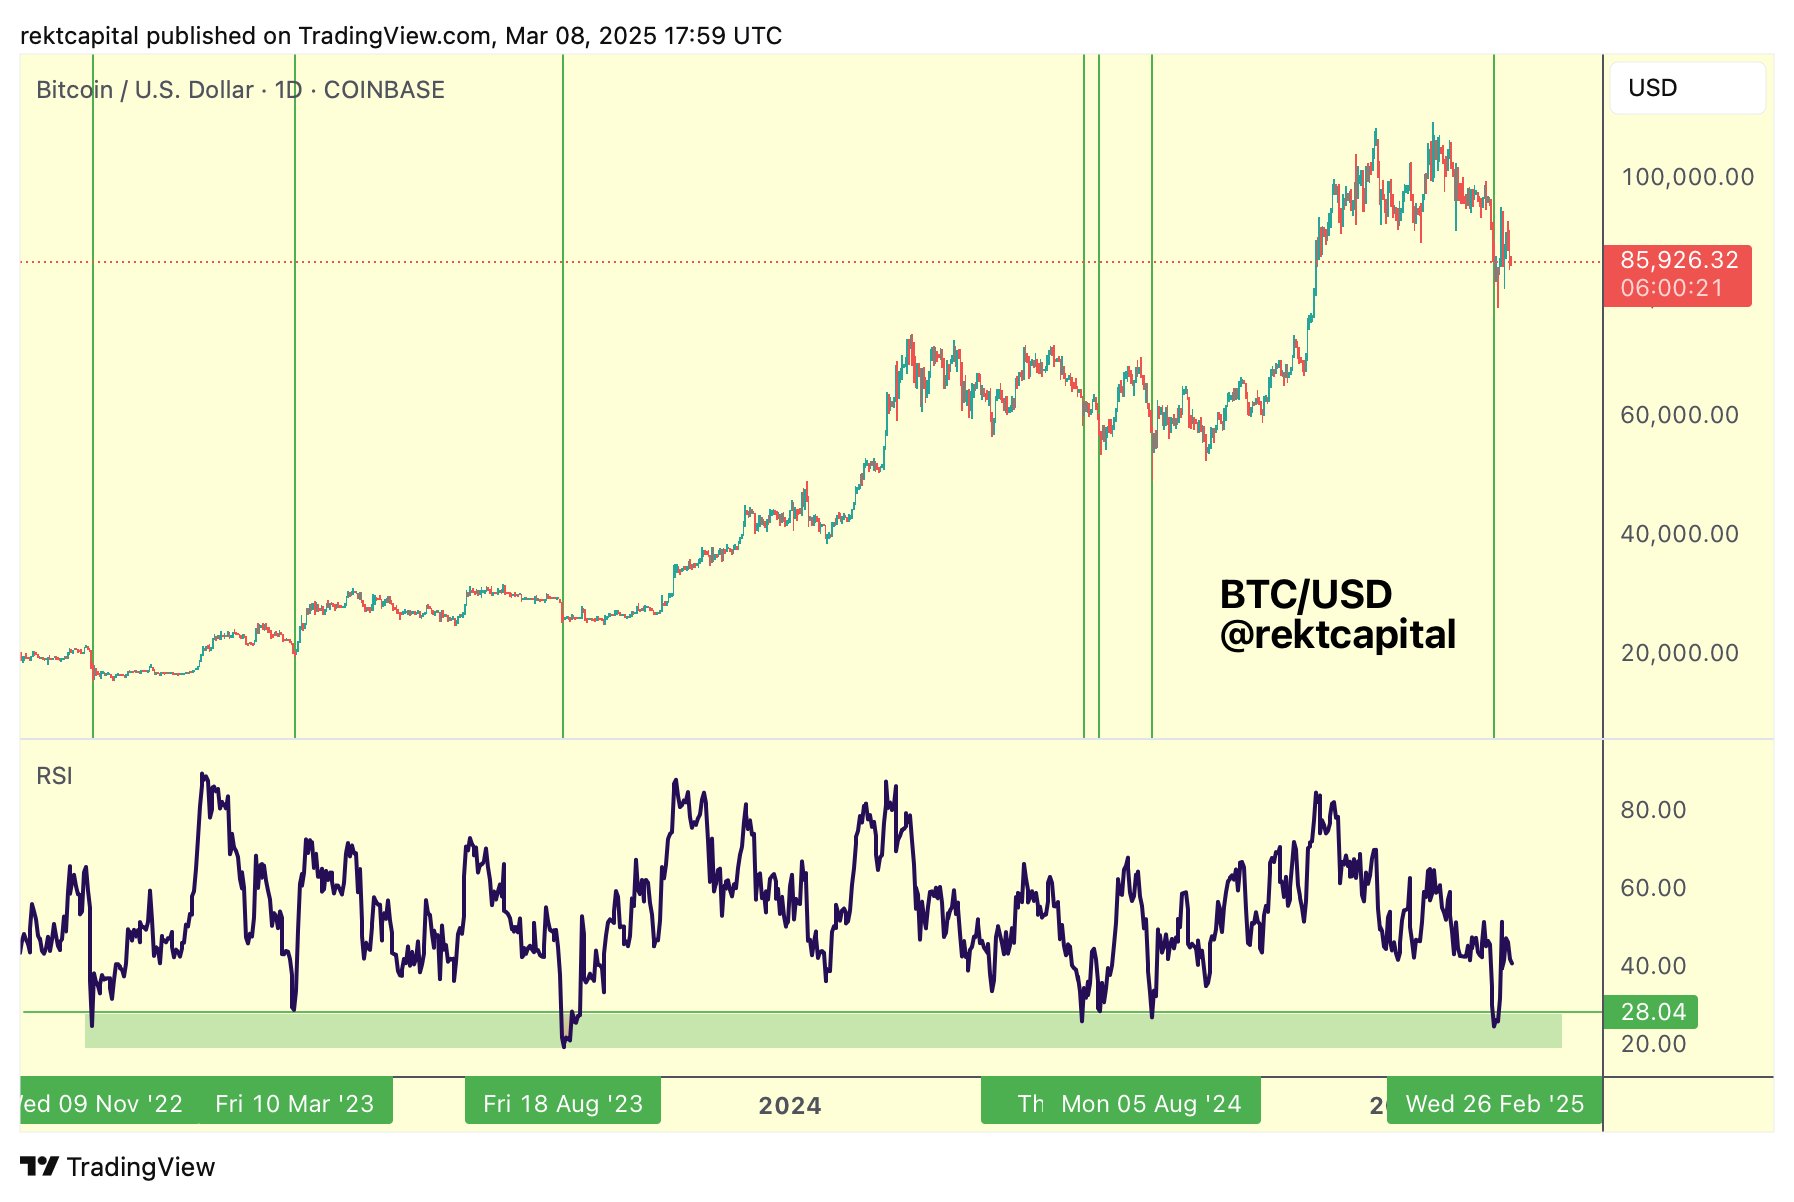
According to Rekt Capital, historical data shows that Bitcoin may find a solid bottom between $78,000 and $71,700.
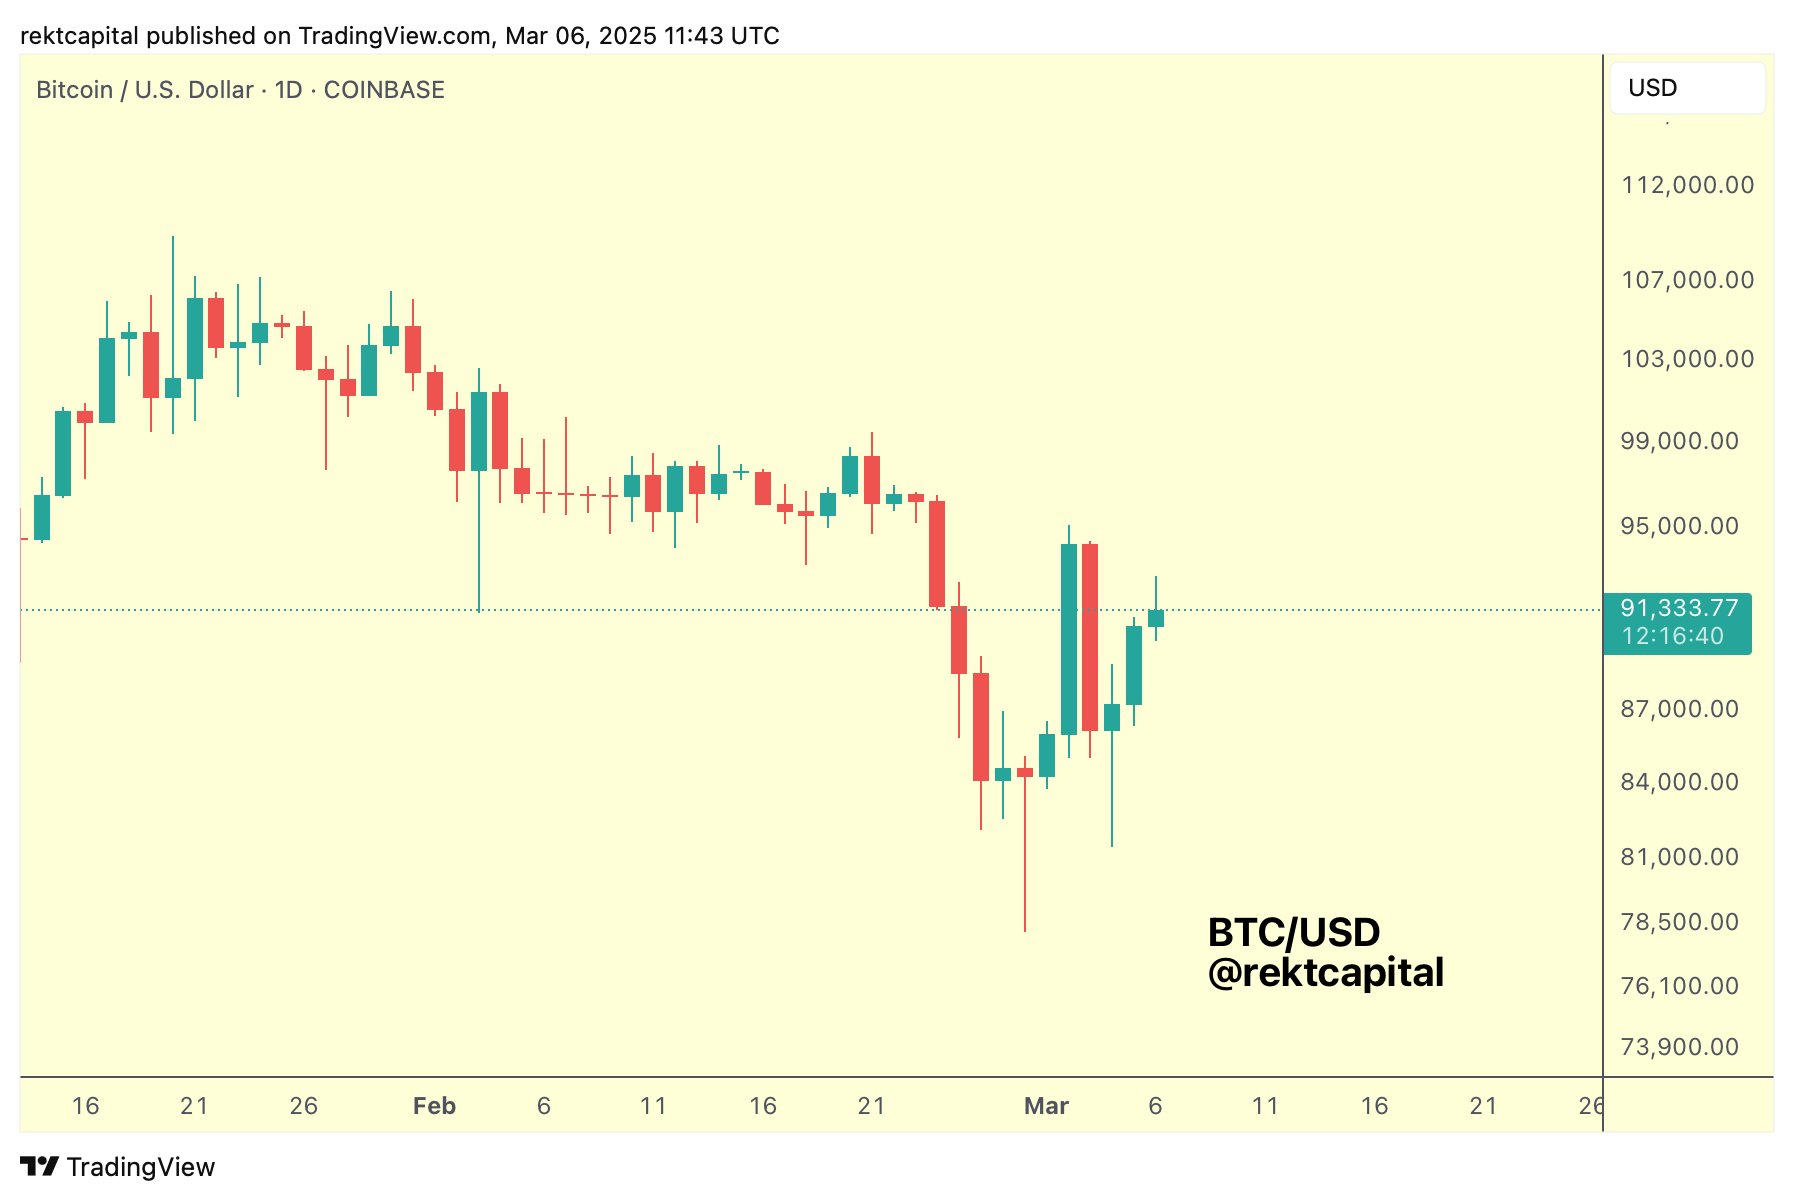
“Bitcoin has made yet another Lower High on the Daily.
There’s no denying that.
But throughout this entire cycle, whenever Bitcoin would reach 28 or lower on the RSI…
Bitcoin’s price would either bottom or be between -2% to -8% away from the bottom.”

To support his stance that Bitcoin is now in the process of bottoming out, the trader says BTC may be following in the footsteps of the layer-1 protocol Cronos (CRO). According to Rekt Capital, CRO may be in the midst of ending its downtrend with a double-bottom pattern.
“What’s interesting to see is that BTC is trying to build out a potential Double Bottom-like formation here.
Whereas CRO has potentially broken out from its own Double Bottom, in fact leading Bitcoin.
Other Altcoins are in varying phases of their own respective Double Bottoms.”

A double-bottom structure is traditionally viewed as a bullish reversal pattern as it indicates that the asset has found a price floor and is gearing up for an upside burst.
Based on the trader’s chart, he seems to suggest that CRO has taken out the resistance of the pattern at around $0.08. At time of writing, CRO is trading at $0.80.
At time of writing, Bitcoin is trading for $82,207, down over 4% in the past day.
Don’t Miss a Beat – Subscribe to get email alerts delivered directly to your inbox
Check Price Action
Follow us on X, Facebook and Telegram
Surf The Daily Hodl Mix
 

Disclaimer: Opinions expressed at The Daily Hodl are not investment advice. Investors should do their due diligence before making any high-risk investments in Bitcoin, cryptocurrency or digital assets. Please be advised that your transfers and trades are at your own risk, and any losses you may incur are your responsibility. The Daily Hodl does not recommend the buying or selling of any cryptocurrencies or digital assets, nor is The Daily Hodl an investment advisor. Please note that The Daily Hodl participates in affiliate marketing.
Generated Image: Midjourney